Are catchments leaky?

leaky watersheds.png

Author

Ying Fan

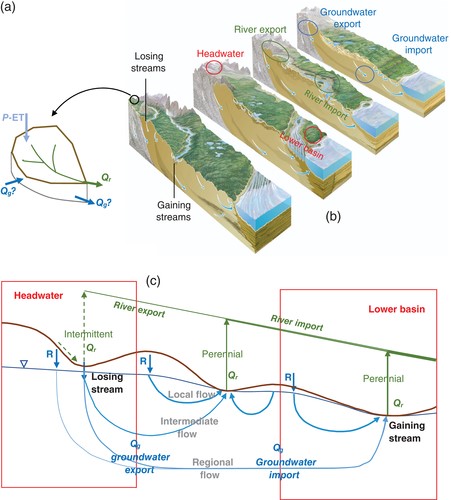
Catchments, generally understood as the drainage areas of low‐order streams, are often regarded as closed hydrologic entities; that is, precipitation (P) minus evapotranspiration (ET) over a catchment equates stream outflow (Q r). Here, we review evidence that catchments can be leaky due to groundwater outflow or inflow across topographic divides, based on catchment mass balance across a continent and several site‐based studies across the globe. It appears that a catchment is more likely to be leaky with the combination of the following factors: small catchment size, positioned at either the high or low end of a steep regional topographic and climatic gradient, underlain by deep permeable substrates that extend beyond the study catchment, and in drier climate or dry seasons and droughts. Catchment leakage has hydrological, geochemical, and ecological implications. Thus, catchments are best framed as semiclosed hydrologic units perched on top of a larger, regional hydrogeological system with no real boundaries regarding the movement of water and solutes.

A complex network analysis of Spanish river basins

CNA Spain

Authors

R. Rodríguez-Alarcóna, S. Lozano

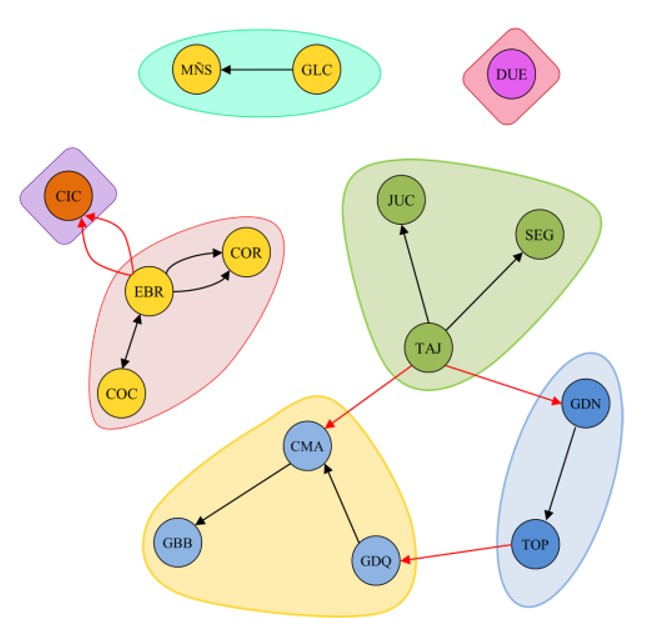
This paper carries out a study of Spanish river basins for the period 2008–2014 using complex network analysis (CNA) tools. The purpose is to gain insight into the structure and characteristics of the national hydrological system with an emphasis on the interconnectivity between the different river basins and the extent to which the current IBT can mitigate the rainfall imbalances of the country, particularly in a scenario of climate change. Apart from the size of the corresponding catchment areas, data on water demand for irrigation, industrial and municipal water supply, historical catchment inflows, reservoir capacity and historical levels, interbasin transfer infrastructures and historical interbasin transfer (IBT) flows, and ocean discharges were collected. A weighted directed network is built with all this information and a number of CNA characterization measures. It has been found that the system has a two-tier structure with a few river basins (hubs) that supply IBT flows to a relatively large number of receiver river basins. Some of those receiver river basins have incoming links from more than one source river basin. This diversification of IBT sourcing is necessary since the availability of water for IBT from a single river basin is not guaranteed. The CNA results also indicate that the IBT infrastructure has been designed to supply water from the river basins with surplus reservoir capacity to river basins with water deficits. The community structure of the system has also been determined with some groups of river basins forming separate, self-sufficient subsystems and other communities minimally connected by IBT links. It can be concluded that the topology and characteristics of the network are a consequence of the imbalances created by the varying climatic conditions of the river basins, the water storage capacity provided by the existing reservoir infrastructure, the geographical and orographic constraints of the country and the high cost of establishing links between neighbouring river basins.

Microbial mat contribution to the formation of an evaporitic environment in a temperate-latitude ecosystem

Evaporite

Authors

Vanesa Liliana Perillo, Lucía Maisano, Ana María Martinez, Isabel Emma Quijada, Diana Graciela Cuadrado

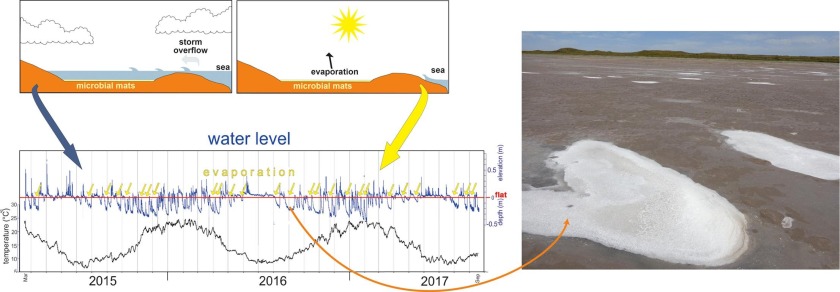
An evaporitic environment is characterized by having high salinity, climatic, and hydrological factors that promote a negative water balance; however, biological factors may also influence their development. Modern coastal flat Paso Seco (40°33′S; 62°14′W) is located in a semi-arid region with low precipitation and dry winds coming mainly from the NW. The site is an old tidal channel, which nowadays behaves like a shallow coastal saline-like basin, separated from the sea by a sand barrier, which the sea periodically overcomes, flooding the flat with eventual water evaporation. Microbial mats of up to 1 cm thick colonize the sandy sediments of this evaporitic environment. Water samples were taken during five field trips (2017–2018) from interstitial water of the flat, a tidal creek that crosses the flat, and two shallow tidal depressions (TDs) within the flat with different degrees of evaporation. In comparison to the sea, the maximum salinity values measured in Austral spring (September 2017) in the tidal creek were doubled, tripled in interstitial water, and 5.9 to 8 times higher in TDs. Ionic concentration denotes that evaporite chemical divides are followed as water evaporates, corresponding to the presence of CaCO3, gypsum and halite found in TDs. On-site permeability of microbial mat-covered surfaces presented semi-pervious properties. Microbial mat presence is condition for CaCO3, gypsum, and halite precipitation as they allow for water retention and its consequent evaporation due to the impermeability they confer to the sedimentary surface. Thus, microbial mats are a biological factor affecting the development of an evaporitic environment.

Application of remote sensing to water environmental processes under a changing climate

RM Global

Authors

Xintong Cui, Xiaoyu Guo, Yidi Wang, Xuelei Wang, Weihong Zhu, Jianghong Shi, Chunye Lin, Xiang Gao

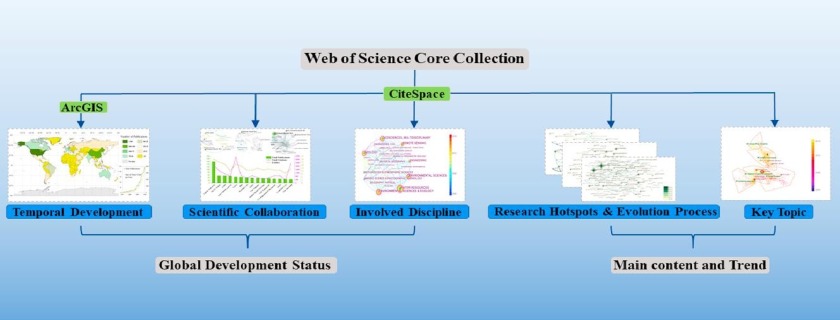
Remote sensing, as a crucial method to obtain information on water environmental processes, has become a major source of data, particularly of water environment and water resources, which are sensitive to global climate change. The bibliometric analysis provided here shows the research characteristics and developments of remote sensing-based observations of water environmental processes under a changing climate from 2000 to 2018. Visualized knowledge mapping is introduced to investigate the development status, scientific collaboration, involved disciplines, research hotspots and emerging trends of this field. The breadth and depth of remote sensing application in water environmental process studies have improved significantly as the number of related publications rose at an average annual growth rate of 15.97% in the 21st century. The United States and China were the leading contributors with the largest number of publications and all of the top 15 most active institutions. In addition, this field is a highly interdisciplinary field that covers a wide range of interests, from water resources to environmental science, geology, engineering, ecology, and agriculture. The application of remote sensing technology has significantly promoted the estimation of evapotranspiration and soil moisture, thereby offering a more complete perspective to the understanding of the water cycle. Additionally, climate change and its complex interactions with water environmental processes, including the occurrence of drought events, are of great significance and require special attention.

Observations and modeling of the surface seiches of Lake Tahoe, USA

Tahoe Seiche

Authors

Derek C. Roberts, Heather M. Sprague, Alexander L. Forrest, Andrew T. Sornborger, S. Geoffrey Schladow

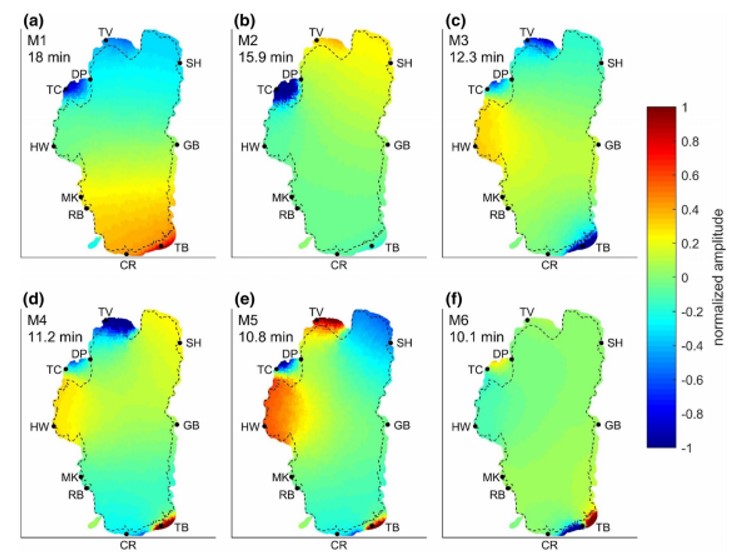
A rich array of spatially complex surface seiche modes exists in lakes. While the amplitude of these oscillations is often small, knowledge of their spatio-temporal characteristics is valuable for understanding when they might be of localized hydrodynamic importance. The expression and impact of these basin-scale barotropic oscillations in Lake Tahoe are evaluated using a finite-element numerical model and a distributed network of ten high-frequency nearshore monitoring stations. Model-predicted nodal distributions and periodicities are confirmed using the presence/absence of spectral power in measured pressure signals, and using coherence/phasing analysis of pressure signals from stations on common and opposing antinodes. Surface seiches in Lake Tahoe have complex nodal distributions despite the relative simplicity of the basin morphometry. Seiche amplitudes are magnified on shallow shelves, where they occasionally exceed 5 cm; elsewhere, amplitudes rarely exceed 1 cm. There is generally little coherence between surface seiching and littoral water quality. However, pressure–temperature coherence at shelf sites suggests potential seiche-driven pumping. Main-basin seiche signals are present in attached marinas, wetlands, and bays, implying reversing flows between the lake and these water bodies. On the shallow sill connecting Emerald Bay to Lake Tahoe, the fundamental main-basin seiche combines with a zeroth-mode harbor seiche to dominate the cross-sill flow signal, and to drive associated temperature fluctuations. Results highlight the importance of a thorough descriptive understanding of the resonant barotropic oscillations in any lake basin in a variety of research and management contexts, even when the magnitude of these oscillations tends to be small.

Understanding transport and transformation of dissolved inorganic carbon (DIC) in the reservoir system using δ13CDIC and water chemistry

DIC isotopes

Authors

Wanfa Wang, Si-Liang Li, Jun Zhong, Cai Li, Yuanbi Yi, Sainan Chen, Yimeng Ren

In order to advance our understanding of the driving factors controlling carbon dynamics and evolution of water quality in river-reservoir systems for the generation of hydropower, we conducted a study in a karst deep-water reservoir (Wujiangdu Reservoir), southwest China. Water samples were collected from the inflow/outflow of the Wujiangdu Reservoir, four vertical columns along the reservoir, and from three tributaries to the reservoir in January, April, July, and October 2017. The dissolved inorganic carbon (DIC) concentrations and carbon isotope composition (δ13CDIC) varied greatly (1.99–3.45 mmol/L and −10.7‰ to −6.0‰, respectively) and were controlled by multiple processes including CO2outgassing, primary production, and organic matter degradation. In the four vertical profiles, the difference between the values of samples with those at 15 m of Δ[DIC] and Δ[δ13CDIC], Δ[DIC] and ΔCa2+ in the same water column had positive correlations, and the variation in dissolved O2, partial pressure of CO2, and flux of CO2 suggested that primary production dominated above the epilimnion and degradation of OM dominated below the epilimnion during the warm season. Continuous CO2 outgassing was found from riverine water to surface water of the reservoir before the dam based on carbon isotopic compositions and water chemistry. These processes would cause isotopic fractionation between the residual DIC and CO2 (aqueous), the degree of which varied among different seasons (July > April > October > January). Carbon transport and biogeochemical processes were highly controlled by the hydraulic retention time (HRT) in the river-reservoir system. It was estimated that approximately 71.5% of the annual DIC flux was produced in the water column below 15 m depth during the study year, suggesting that the processes of DIC generation and consumption occurred at the same time. The results highlight that carbon behavior in the impounded rivers is influenced by multiple processes. The carbon transformation processes should be taken into account for improving the estimation accuracy of the carbon budget calculations and the management of water quality for river-reservoir systems.

Assessing future water–sediment interaction and critical area prioritization at sub-watershed level for sustainable management

Soil Erosion Classes

Authors

Ashish Pandey, Santosh S. Palmate

Changes in the response of water and sediment have brought imbalances in present land resources as well as future management practices. Such critical areas need to be identified and prioritized for conservation and protection interventions. The Betwa River basin, located in the central part of India, has natural resources problems due to hydrologic changes. Thus, the present study has been focused on water–sediment interaction and prioritization of critical areas identified from a simulation using the Soil and Water Assessment Tool (SWAT). A downscaled and bias-corrected CMIP5 global climate model dataset has been used to simulate the water and sediment yields of the river basin. The analysis period was grouped into a 20-year period starting with a baseline of 1986 (from 1986 to 2005) and four future horizons, i.e. horizon 2020 (2020–2039), horizon 2040 (2040–2059), horizon 2060 (2060–2079) and horizon 2080 (2080–2099). Based on the sediment yield obtained from the SWAT simulation, identification of an empirical relationship and prioritization of critical areas were carried out. Results show that the relationship between annual water and sediment yields has a good correlation (R2 = 0.75) for horizon 2020; however, a low correlation (R2 = 0.63) was observed for horizon 2060. The analysis reveals that the water–sediment interaction will be affected due to changes of monsoon precipitation in future. Based on priority treatment, the critical sub-watersheds were identified and prioritized for the baseline as well as future climate horizons. Analysis shows that the sediment yield of sub-watersheds SW-5, SW-6, SW-11, SW-17, SW-18, SW-34 and SW-45 has increased with changing climate conditions. Further, these sub-watersheds would undergo changes in erosion class from moderate to very severe. Thus, the identified critical sub-watersheds for the baseline as well as for future climate conditions need to be considered for prioritization and management. The present approach can be used for sub-watershed-level sustainable planning and management.


Assessment of large-scale patterns of hydrological alteration caused by dams

Spain watersheds

Authors

Francisco J. Peñas, José Barquín

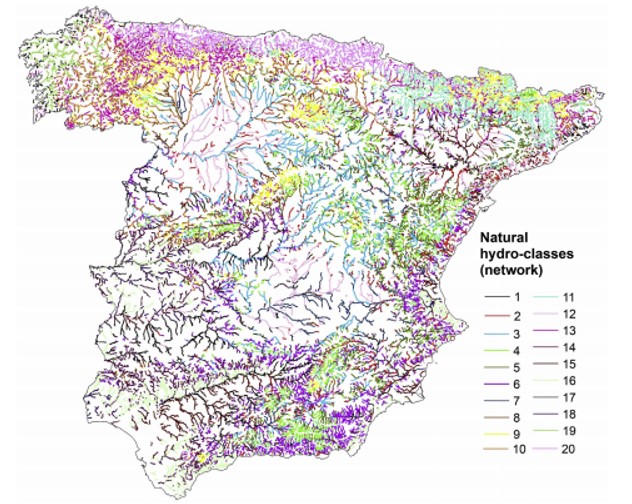
Nowadays, alteration of the natural flow regime is considered one the most widespread and damaging impacts for river ecosystems. Hence, increasing our understanding of large-scale hydrological alteration patterns would help us design more effective water use policies. The present study aims to establish general patterns of hydrological alteration caused by dams on a national level, with Spain as a case study. First, we developed a classification of the natural flow regime of the Spanish river network, which served as the reference to assess the degree of hydrological alteration of 139 altered-river gauges. In addition, using the flow series of the altered-river gauges we defined a set of 7 types of altered regimes (TARs), which allowed the stratification of the analyses. The results revealed that the magnitude and direction of hydrological alteration depended on the natural flow class of the altered rivers. In this regard, major effects of dams on Spanish rivers were related to the modification of the intra-annual variability of daily flow, the magnitude of seasonal maximum and minimum flows and the patterns of high flow events. Our results also showed that the distribution of the TARs partially followed a geographic order, but associations between TARs and natural flow classes were not straightforward. In addition, we highlighted that the nature of the hydrological alteration was independent of the registered dam uses.

A new approach for river network classification based on the beta distribution of tributary junction angles

River Networks

Authors

Kichul Jung, Ju-Young Shin, Daeryong Park

Different river networks in nature have distinct features depending on regional constraints; these affect the development of the river network and form different characteristics. The differences in drainage networks help in distinguishing between various network types and understanding natural processes. The aim of this study is to develop a new and simple classification method for determining various river network types based on a critical parameter of river networks, the tributary junction angle. For the analysis, fifty river networks are predefined as five network types (dendritic, parallel, pinnate, rectangular, and trellis networks). The tributary junction angles are calculated for each drainage network type, and then the beta distribution is employed to identify distributional characteristics of the junction angles. Parameter estimates of the beta distribution are used to classify different river networks because the estimates provide classified features of natural processes. Support Vector Machines are then utilized to determine the network classification with the parameter estimates. Furthermore, the results are validated against classification using a different approach with commonly used statistics. The proposed method can clearly distinguish between different network types, except for the rectangular and trellis types. In addition, parameter estimates of the beta distribution indicate differences in drainage network types more clearly than the statistics of the angles. Overall, the parameter estimates of beta distribution have high potential for application to the classification of river networks.

A global lake and reservoir volume analysis using a surface water dataset and satellite altimetry

hess-23-669-2019-avatar-web

Authors

Tim Busker, Ad de Roo, Emiliano Gelati, Christian Schwatke, Marko Adamovic, Berny Bisselink, Jean-Francois Pekel, and Andrew Cottam

Lakes and reservoirs are crucial elements of the hydrological and biochemical cycle and are a valuable resource for hydropower, domestic and industrial water use, and irrigation. Although their monitoring is crucial in times of increased pressure on water resources by both climate change and human interventions, publically available datasets of lake and reservoir levels and volumes are scarce. Within this study, a time series of variation in lake and reservoir volume between 1984 and 2015 were analysed for 137 lakes over all continents by combining the JRC Global Surface Water (GSW) dataset and the satellite altimetry database DAHITI. The GSW dataset is a highly accurate surface water dataset at 30 m resolution compromising the whole L1T Landsat 5, 7 and 8 archive, which allowed for detailed lake area calculations globally over a very long time period using Google Earth Engine. Therefore, the estimates in water volume fluctuations using the GSW dataset are expected to improve compared to current techniques as they are not constrained by complex and computationally intensive classification procedures. Lake areas and water levels were combined in a regression to derive the hypsometry relationship (dh dA) for all lakes. Nearly all lakes showed a linear regression, and 42 % of the lakes showed a strong linear relationship with a R2 > 0.8, an average R2 of 0.91 and a standard deviation of 0.05. For these lakes and for lakes with a nearly constant lake area (coefficient of variation < 0.008), volume variations were calculated. Lakes with a poor linear relationship were not considered. Reasons for low R2 values were found to be (1) a nearly constant lake area, (2) winter ice coverage and (3) a predominant lack of data within the GSW dataset for those lakes. Lake volume estimates were validated for 18 lakes in the US, Spain, Australia and Africa using in situ volume time series, and gave an excellent Pearson correlation coefficient of on average 0.97 with a standard deviation of 0.041, and a normalized RMSE of 7.42 %. These results show a high potential for measuring lake volume dynamics using a pre-classified GSW dataset, which easily allows the method to be scaled up to an extensive global volumetric dataset. This dataset will not only provide a historical lake and reservoir volume variation record, but will also help to improve our understanding of the behaviour of lakes and reservoirs and their representation in (large-scale) hydrological models.